YouTube channel analyzer: what the report shows and how I read it
A channel analyzer gives one page per channel: five scores, three fixes, sponsors with evidence and niche. My own channel on 8 Nov 2026, section by section.
A YouTube channel analyzer is a one-page read of any public channel: who the channel is in one line, five scores from 0 to 100 (consistency, engagement, discoverability, commercial readiness, audience care), the three things to fix first, the numbers under each score, a sponsor table with evidence for every brand, and a read of the niche. Everything on the page comes from public data through the official YouTube Data API, so it works on your own channel, a competitor's, or a creator you are about to pay. What it cannot show is anything private: watch time, audience country, earnings, rates. The way to read the page is top to bottom, in the order it is laid out, because each section explains the one above it: the channel line sets the scale, the scores give the verdict, and the sections underneath give the numbers the verdict was built from.
I run a Cloud & DevOps tutorial channel, @rahulwagh, with 105,000 subscribers and 371 videos, next to a full-time job, and I built the free channel analyzer this autumn. On 8 November 2026 at 12:44 UTC I ran it on my own channel, the one channel where I can check every number against what I know, and this post walks through the report it produced, section by section, in the order it appears on the page. The numbers below are from that run. Where my channel scores badly (0 of 246 videos with uploaded captions, 4 sponsored videos without the paid-promotion label), I say so, because the point of a report is the parts that sting. In the last 14 days about 150 distinct visitors opened the analyzer page, against 21 in the 14 days before, so there are a lot of first-time readers of the report, and this is the guide I wish I could hand each one.
Section of the report, 8 November 2026
What it showed for @rahulwagh
Channel line
105,000 subscribers, 371 videos, FI, since 2011, last upload 3 days ago, Cloud & DevOps
Videos read
Newest 247, 13 March 2020 to 4 November 2026: 228 long, 19 Shorts
Consistency
81, "Steady schedule": 6 uploads in 90 days against a usual 7, regularity 50 percent
Engagement
41, "Average engagement": median 14.9K views, 1.6 likes and 0.21 comments per 100 views
89, "Sponsor-ready": 7 sponsors, 2 came back, label on 5 of 9 disclosed videos
Audience care
100, "Answers its viewers": 15 of 15 threads replied, median 3 hours
Fix first
Long videos get 3.2x the views; newer half at 50 percent of older half; 4 unlabelled sponsored videos
Sponsors
7 plus 2 possible, 12 of 247 videos (5 percent), Trigger.dev and Oracle returned
Niche read
Cloud & DevOps 99 percent, Programming 9 percent, AI & data 6 percent
Cost
About 18 YouTube API units; the second open of the same report cost 0
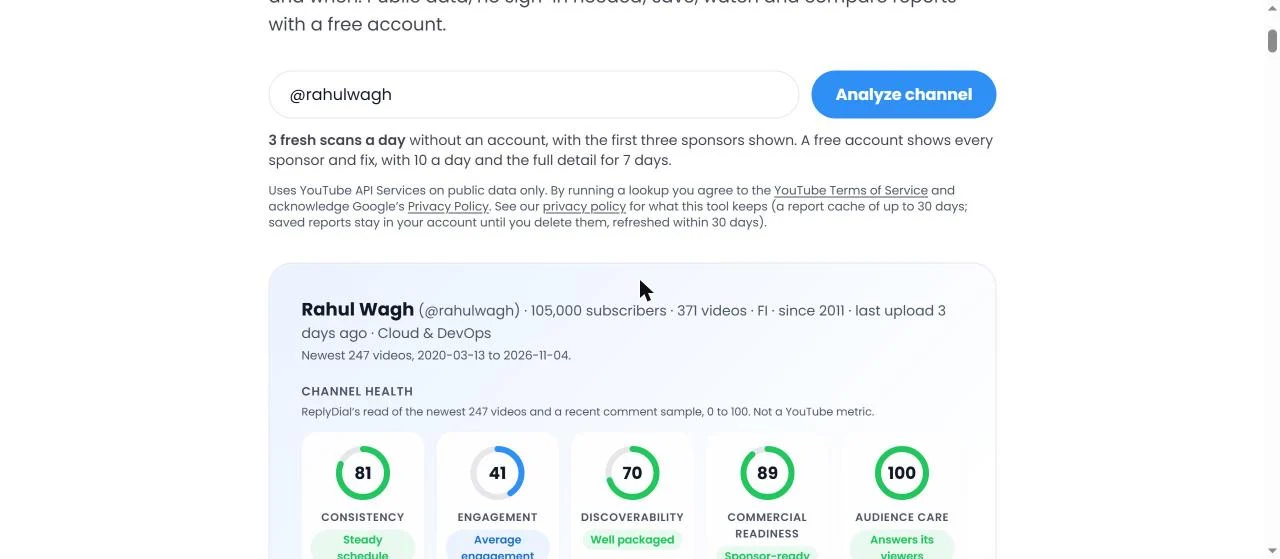
The top of my report on 8 November 2026: the form with @rahulwagh, the channel line (105,000 subscribers, 371 videos, FI, since 2011, last upload 3 days ago, Cloud & DevOps) and the five dials: consistency 81, engagement 41, discoverability 70, commercial readiness 89, audience care 100. Click to enlarge.
What does the channel line tell you before any score?
The first line under the form is the whole channel in six facts: 105,000 subscribers, 371 videos, FI, since 2011, last upload 3 days ago, Cloud & DevOps. I read it first and I read it slowly, because it sets the scale for everything below. 105,000 subscribers against 14.9K median views is a different channel from 105,000 against 50K. 371 videos since 2011 is roughly 25 videos a year, a part-time pace, which is what it is. "FI" is the country the creator set on the channel, which is where I live, not where my viewers are; the analyzer prints it because the API returns it, and I say in every post that the audience's country is not public data. "Last upload 3 days ago" is the only freshness fact a brand needs in the first ten seconds. And the niche chip at the end is the analyzer's own read of my titles, not a YouTube field.
Underneath the line the report says what it actually read: the newest 247 videos, published between 13 March 2020 and 4 November 2026, of which 228 are long videos and 19 are Shorts (3 minutes or less), language en-US. That sentence matters more than it looks. My channel has 371 videos; the report reads up to 300 and this run read 247, the newest ones. Every ratio in the report is a ratio over those 247, or over the 228 long ones, or over the 226 long ones older than 30 days. When a number in the report surprises you, the first question is "over which set of videos", and the answer is always printed next to it.
If you are doing this by hand instead, the channel line is the About tab plus the Videos tab sorted by newest: subscriber count, video count, join date, country, the date of the newest upload. Five minutes, and you have the same six facts.
What are the five scores built from?
The five dials sit directly under the channel line, each with a number from 0 to 100 and a verdict word. Mine on 8 November: consistency 81 "Steady schedule", engagement 41 "Average engagement", discoverability 70 "Well packaged", commercial readiness 89 "Sponsor-ready", audience care 100 "Answers its viewers". The page says next to them that they are ReplyDial's read, not a YouTube metric, and I want to repeat that here: YouTube does not score channels, and nobody outside YouTube has the private data that would make a real score. These are fixed rules over public fields, and I published every rule in the five numbers post so that anyone can disagree with the weights.
The short version of what each score reads:
Score
Built from
Mine, 8 November 2026
Consistency
Uploads in the last 90 days against your own usual pace (40), regularity of gaps between upload days (30), days since the last upload (30)
6 uploads against a usual 7, 50 percent regular, 3 days since the last: 81
Engagement
Likes per 100 views, comments per 100 views, median views as a share of subscribers, averaged and banded, plus a trend modifier of minus 10 to plus 10
1.6 likes (low), 0.21 comments (typical), 14.1 percent views per subscriber (typical), trend at 50 percent: 41
Discoverability
Share of videos with tags (25), titles of 40 to 70 characters (15), descriptions over 200 characters (20), chapters (15), uploaded captions (15), language set (10)
100, 52, 99, 50, 0 and 100 percent: 70
Commercial readiness
Business contact published (25), has had a sponsor (20), a brand came back (15), sells something of its own (15), share of disclosed videos with the paid-promotion label (25)
Yes, yes, 2 came back, sells 3 things, label on 5 of 9: 89
Audience care
Reply rate on recent threads (40), median response time (30), buying questions answered (30)
15 of 15 replied, 3 hours, no buying questions in the sample: 100
The verdict words come from bands: 70 and above gets the good word, 40 to 69 the middle one, below 40 the warning. So "Average engagement" at 41 is one point from a warning, and "Well packaged" at 70 is the lowest score that still gets the good word. Read the number, not the word.
Two of my five moved since the end of October. Consistency went from 85 on 30 October to 81 on 8 November, because the last 90 days now hold 6 uploads where the window a week earlier held 7, and my usual pace is about 7 per 90 days. Nothing else changed. That is how the score should behave: it is a rolling window, so a quiet fortnight costs a few points and a busy one gives them back. The other four were the same to the point.
Why is "Fix first" rules and not opinion?
The box under the dials is called Fix first, and on 8 November it showed three items for my channel, with the page noting that 2 more fixes sit behind a free sign-in:
"Videos over 30 min get 3.2x the views of videos under 8 min." Across 58 and 34 videos. Do this: plan the next five videos over 30 minutes, and move under-8-minute material into those or into Shorts. Area: engagement.
"The newer half of the last year's videos sits at 50% of the older half's median views." Part of that is age, part is topic mix or packaging. Do this: compare the ten best-viewed titles with the ten newest. Area: engagement.
"4 sponsored videos lack YouTube's paid-promotion label." Do this: in Studio, tick "My video contains paid promotion" on each, a minute per video. Area: commercial.
Every one of those is produced by a rule that can fail, not by a person looking at the channel. The rule behind the first fix compares median views by video length and fires when one length bucket is far ahead of another with enough videos in both; 58 and 34 is enough, and 3.2 times is far. The second fires when the newer half of a year's videos sits below 60 percent of the older half's median, and it carries its own caveat about age in the text, because a two-month-old video is still collecting views. The third fires when any disclosed sponsored video lacks the flag, and the count is the count. Each fix also carries a weight, set by how much it tends to move and how cheap it is, and the box shows the top three with at most two from the same area, so a channel with five packaging gaps still hears about its comments.
I read Fix first as "what would a careful friend tell me in the first minute", and I check it against the sections below rather than taking it on trust. On my channel the three fixes match the three weakest facts in the report: the 41 on engagement (fixes 1 and 2), and the 13.9 of 25 I get for labelling (fix 3). No consistency or audience fix fired, which matches the 81 and the 100. When the fixes and the sections disagree, that is a bug to report, and the FAQ under the tool says how.
The rules-not-opinion point matters for a second reason. If you run the report on a creator you want to sponsor, you can show them the fix and the rule, and they can check it in Studio in a minute. "Your newest 4 sponsored videos have no label" is a conversation; "your channel feels under-optimised" is not.
How is audience care measured, and why is my 100 thin?
Audience care is the first section under the fixes, and for a creator it is the one to read first, because it is the only score you can move today without a camera. It reads the comment threads of the newest 5 long videos, up to 100 threads each, skips the channel's own top-level comments, and counts three things: the share of threads with at least one reply from the channel, the median hours from a viewer's comment to that first reply, and whether the buying questions (price, link, how to join, is it still open) got an answer.
My numbers on 8 November: reply rate 100 percent, 15 of 15 threads on the newest 5 long videos; response time median 3 hours; buying questions none in the sample; questions 1 of 1 answered. Score 100.
I want to be plain about why that 100 is thinner than it looks. 15 threads is a small sample. My newest videos have few comments: when I ran the free unanswered comments checker on the same channel the same day, it scanned 142 comments across my 20 newest videos and found 1 unanswered, and the newest video of all, "I Broke My AWS Deploy on Purpose. Ansible + AI Found the Bug", had exactly 1 comment, the unanswered one. Answering 15 of 15 within 3 hours is good, but a channel with 226 threads in its sample and a 34 has done more work than I have, even if it did it worse. The report prints the sample size next to the rate for exactly this reason, and a channel with fewer than 10 threads gets a dash instead of a score.
When a channel with 20 or more sampled threads answers under 30 percent of them, the report puts a red line under the scores saying how many of the recent comments got no reply. It is the only red element on the page. If you are vetting a creator, that line is worth more than the engagement score: viewers who ask about the sponsor's product under a sponsored video and get no answer are the brand's lost sales, and the comment section is where you see it.
What does the engagement section show that the score hides?
My engagement is 41, and the section underneath explains it in four tiles and two charts. The tiles: median views 14.9K across 226 long videos older than 30 days; views per subscriber 14.1 percent (typical); likes per 100 views 1.6 (low); comments per 100 views 0.21 (typical). The sample is long videos older than 30 days on purpose, because a video published last week has not finished collecting views and Shorts have different ratios, so the 19 Shorts and the newest uploads are left out.
The 1.6 likes per 100 views is my weakest ratio and the honest cause of the 41. The band treats 2 as fine and 4 as strong; mine is under the fine line. Comments at 0.21 per 100 clear the 0.2 line by a hair. Views per subscriber at 14.1 percent clears 10 percent and is far from 30. Then the trend modifier takes its 10 off, because the newer half of the last year's videos sits at 50 percent of the older half's median.
The chart I read before the score is median views by video length. On 8 November: under 8 minutes 11.3K across 34 videos; 8 to 15 minutes 13.3K across 54; 15 to 30 minutes 13.6K across 80; over 30 minutes 36.4K across 58. The three shorter buckets are within a few thousand of each other, and the long bucket is 3.2 times the shortest. That is the first fix, and it is the clearest thing the whole report says about my channel: my audience comes for full courses, not clips. A ratio score cannot tell you that. A chart with 226 videos sorted into four buckets can.
The outliers list under it exists so that the median is not mistaken for the channel. My five most-viewed videos in the sample: the AWS VPC tutorial (Part-5) at 276.3K, 18.6 times my median; the Complete Helm Chart Tutorial at 268.1K, 18 times; the AWS IAM User tutorial (Part-1) at 251.2K, 16.9 times; Ansible Full Course at 221.1K, 14.9 times; and the AWS EC2 Full Course at 201.8K, 13.6 times. Every one of them is a long, foundational tutorial on a core cloud topic, older than 30 days and still collecting views. If you are a brand reading my report, those five are the videos your integration would not have been in, and the 14.9K median is the number to price on. If you are me, those five are a list of topics the audience has already voted for.
By hand, the same read is the Videos tab sorted by popular next to the Videos tab sorted by newest, with the lengths noted. Twenty minutes for 30 videos. The analyzer does it over 226.
How do you read consistency without being fooled by volume?
Consistency is 81, "Steady schedule", and the section under it shows the last 90 days (6 uploads against my usual 7), regularity (50 percent of gaps near the usual rhythm, marked uneven), the longest gap (68 days) and the shortest (4), and the share of Shorts among scanned uploads (8 percent).
The score is not "do you upload a lot". It is "do you upload the way you usually upload, on a rhythm, and recently". My pace part is 6 against a usual of about 7, so I lose a few of the 40 points there. Regularity is where I lose most: only half the gaps between my upload days fall within half to double my median gap, because I go quiet for 68 days and then publish four videos in a month. That is 15 of 30. Recency is the full 30, because the newest upload was 3 days before the scan. A channel that published exactly two videos a month for a year would beat me on regularity with fewer total uploads, and I think that is right: viewers and the suggested feed both reward a rhythm they can predict.
The 8 percent Shorts line is descriptive, not scored. It is there because a brand buying a long-form integration wants to know whether the channel is a long-form channel, and 19 of 247 says mine is.
The failure case this section is built to catch is the channel that has gone quiet. A channel whose newest upload is 262 days old scores 0 here however good its other four numbers are, and the first thing anyone needs to know about that channel is that it stopped. If you are reading a report for a sponsorship, look at "last upload" in the channel line and the 90-day count here before anything else.
What does discoverability count, and where is my 0?
Discoverability is 70, "Well packaged", and the section lists six packaging facts with the share of videos that have each: tags 100 percent (245 of 246); uploaded captions 0 percent (0 of 246, and the tile says auto-generated captions do not count); chapters 50 percent (113 of 227 long videos); descriptions of 200 or more characters 99 percent (median 2,772 characters); titles of 40 to 70 characters 52 percent (median 61); language set 100 percent. Each fact is a checkbox or a text box in YouTube Studio, which is why this is the cheapest score to move.
My 0 is uploaded captions, and I will say again what I said in October: it looked like a bug the first time I saw it, and it is not. The API's caption flag is true only when the creator uploaded a caption track. YouTube's auto-generated captions do not count, and on every one of my 246 videos I have relied on them. Uploaded captions are what the search index reads word for word, which is why they keep their 15 points, and 0 of 246 is my real number. The 50 percent on chapters is the other gap: 113 of my 227 long videos have three or more timestamp lines, the rest do not, and my long tutorials are exactly the videos where a viewer wants to jump to the part they need.
Under the six facts is a table of title forms on this channel by median views, and it is descriptive rather than scored. Mine on 8 November: titles with brackets 2.7 times the median (48 titles); titles with a colon 1.4 times (38); questions 1.2 times (70); titles with a number 1.1 times (171); "How to" titles 0.9 times (29); "vs" titles 0.3 times (5). The count is printed next to each multiple so that you can see what to trust. 48 bracketed titles at 2.7 times is a pattern; 5 "vs" titles at 0.3 times is noise. My bracketed titles are the "(Part-5)" style of my course series, which is also where the outliers live, so the two findings say the same thing from two directions.
The most-used tags line (devops, aws, cloud, terraform, kubernetes, ansible, aws solution architect associate, google cloud, git, github) is the fastest way to confirm what a channel is about without watching it. If you are vetting a creator for a developer-tool campaign, those ten words tell you in two seconds whether the audience is the one you want.
What is commercial readiness, and why does the label count for 25?
Commercial readiness is 89, "Sponsor-ready", and it answers the question an agency analyst asks in the first three minutes: can I reach this creator, have they done this before, did anyone come back, do they sell their own things, and do they disclose. The section shows: business contact published in a description (the address itself is masked on the public report); sponsors 7, 2 came back; paid-promotion label on 5 of 9 disclosed videos; sells 3 things (a course, a membership or community, and coaching or consulting).
The arithmetic of my 89: 25 for the contact, 20 for having had sponsors, 15 for the two brands that came back, 15 for selling something of my own, and 25 times 5 over 9 for labelling, which is 13.9. The 4 unlabelled videos are the third fix. I wrote about what the paid-promotion label means in October, including the fact that on my own channel the descriptions name the sponsor on more videos than the label does, and the report has reminded me of the 4 every week since. That is what the report is for.
The label is worth 25 of 100 for a reason I would defend: for a brand with a compliance team, a creator whose sponsored videos all carry the flag is a creator who will disclose your deal without being chased. For a creator, ticking the box is a minute per video in Studio. There is no cheaper 11 points anywhere on the page than the ones I am leaving on the table.
What the section does not and will not show is a rate. Public data does not include audience country, watch time or past deal prices, and a confident-looking number built on guesses would mislead you. The 15-minute vetting checklist covers what to ask the creator directly, because the answers are not public.
How do you read the sponsor table, the evidence chips and "returned"?
The sponsor section is the part agencies use most, and on my channel it opens with one sentence: 7 sponsors plus 2 possible; 12 of the newest 247 videos (5 percent) show a sponsor, 8 flagged by YouTube as paid promotion, 9 disclosed in the description; 2 brands came back in more than one month, Trigger.dev and Oracle. Then three tiles: Takes sponsors, regular, 8 of the last 30 long videos; Last sponsored, 32 days ago; Reachable, email published.
Those three tiles are the summary a brand reads before the table. "Regular" is the band for 4 to 10 sponsored videos among the last 30 long ones; under that is "occasional", over it is "heavily sponsored", and none is "no recent sponsor". "32 days ago" is the gap the tool computed since my newest sponsored video; the Trigger.dev row's last date is 6 October. A channel whose last sponsor was three years ago is a different conversation from one whose last sponsor was last month, and the tile says which one you are having.
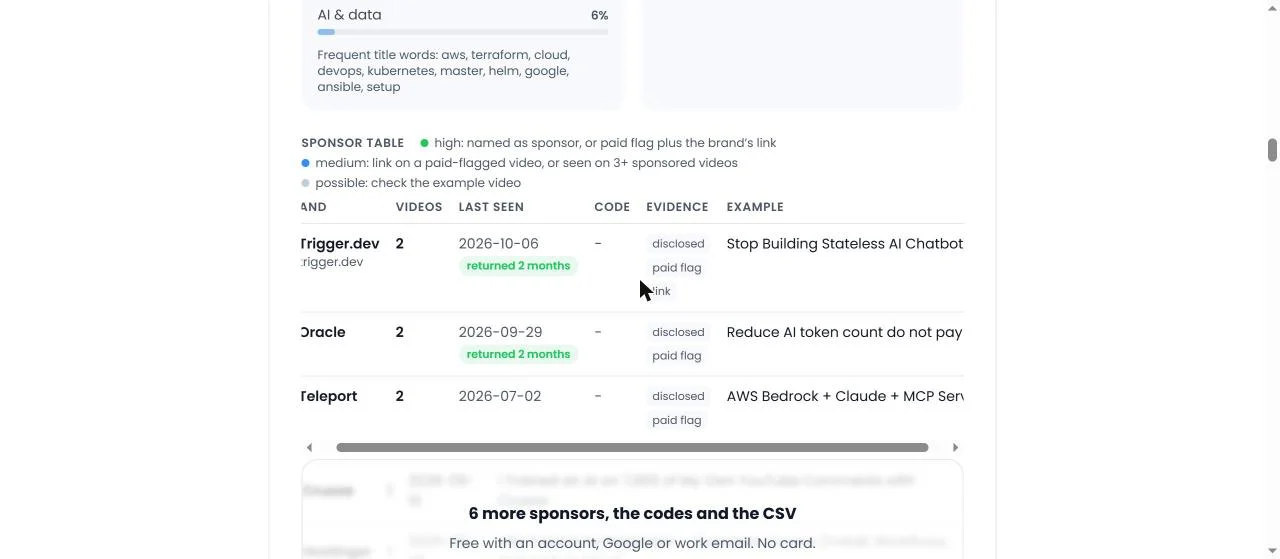
The sponsor table on 8 November 2026 without an account: Trigger.dev (2 videos, last 6 October 2026, returned 2 months, disclosed + paid flag + link), Oracle (2 videos, last 29 September 2026, returned 2 months, disclosed + paid flag) and Teleport (2 videos, last 2 July 2026, disclosed + paid flag), each with an example video, and the blurred panel saying 6 more sponsors, the codes and the CSV are behind a free sign-in. Click to enlarge.
Each row of the table is brand, domain, videos, first and last date, code, evidence, example video. Here is how I read mine, row by row:
Trigger.dev (trigger.dev): 2 videos, last 6 October 2026, "returned 2 months", evidence disclosed, paid flag and link, example "Stop Building Stateless AI Chatbots: Build a Durable Kubernetes Agent Instead". All three signals, two months apart. This is the strongest kind of row there is.
Oracle: 2 videos, last 29 September 2026, "returned 2 months", evidence disclosed and paid flag, example "Reduce AI token count do not pay for every conversation". No link chip: the brand came from the words and the flag, not from a link resolved to the brand's own domain.
Teleport: 2 videos, last 2 July 2026, evidence disclosed and paid flag, example "AWS Bedrock + Claude + MCP Server: Build a Production AI Agent (Powered by Teleport)". Two videos but no "returned" badge, because both were published on the same day; returned means a sponsored video in two or more different calendar months.
Crusoe: 1 video, 16 September 2026, "I Trained an AI on 7,000 of My Own YouTube Comments with Crusoe".
Hostinger: 1 video, 26 August 2026, the n8n tutorial for beginners.
Kestra: 1 video, 31 March 2026, "What Happens When AI Runs Your Cloud?".
Upcloud: 1 video.
N8n: 1 video, the same n8n tutorial, which is the row I come back to under "what broke".
The evidence chips name which of the three public signs the brand was found by. "Disclosed" means the description says it in words: "sponsored by", "thanks to X for sponsoring", "(Powered by X)". "Paid flag" means YouTube's paid-promotion flag is on for that video. "Link" means a link in the description was followed to the brand's own domain, through any shortener or tracker on the way. A row with all three is as sure as public data gets. A row with only "link" is where you open the example video before you believe it.
The confidence dot next to each brand follows from the chips. High: the brand is named as sponsor in the description, or the paid flag plus the brand's own link. Medium: a link on a video YouTube flagged as paid promotion, or a link seen on three or more sponsored videos. Possible: a link on a sponsored video that may be a reference rather than the sponsor, shown greyed with a "possible" tag and left for you to confirm.
The "returned N months" badge is the one I would tell a brand to look at first. It means the brand had a sponsored video in that many different months. A brand that comes back after seeing the first video's numbers is the strongest public signal of an integration that worked for the brand, because the brand had the results and paid again anyway. Trigger.dev in February and October, Oracle in June and September. If you are a creator writing a media kit, your returning sponsors are the first line.
And the example video column is the audit trail. Every brand links to one video where it was found, so a wrong row can be checked in one click. I wrote the full method for reading the three signals by hand in how to see who sponsored a YouTube channel, including the two brands an earlier version of this table invented on my own channel and how I fixed the rules.
What is the niche read, and why does it add up to more than 100?
The niche box says: Cloud & DevOps 99 percent, Programming 9 percent, AI & data 6 percent. Under it, YouTube's own topic tags for my channel: Lifestyle, Technology, Knowledge. Under that, frequent title words: aws, terraform, cloud, devops, kubernetes, master, helm, google, ansible, setup.
The niche read is a keyword share: the share of my scanned video titles that contain words from each niche's list. Cloud & DevOps matches aws, kubernetes, terraform, ansible, helm and the rest, so 99 percent of my titles match it. Programming matches words like python or api, and 9 percent of my titles have one. AI & data matches ai, agent, llm, n8n and so on, and 6 percent do. A title can match more than one niche, so the shares add to more than 100, and the page labels the read as ReplyDial's own analysis rather than YouTube data. YouTube's own topic tags are printed next to it precisely because they are so coarse: "Lifestyle, Technology, Knowledge" tells a brand nothing that "aws, terraform, kubernetes" does not say better.
The same keyword read is what puts a channel into a niche on Discover, the filterable list where every channel someone has analyzed leaves one row. That is why a channel tagged Programming can still appear in a Cloud & DevOps search: the match is a share of its videos, not a single label.
What does one report cost, and what is cached?
The page says it in one sentence: about 18 YouTube API units per channel, 13 for the videos and 5 for the comment sample; a report is reused for a day, can be refreshed after that, and is deleted after 30 days. The 18 breaks down as 1 unit for the channel, 1 per 50 uploads to list them, 1 per 50 videos to read their details (views, likes and comment counts ride on the same call), and 1 per video for the five-video comment sample behind audience care. Out of the 10,000 units a project gets per day, that is not the constraint; politeness is.
On 8 November I checked the cache the direct way: I fetched my own report a second time as JSON, and it came back with cached: true and the same checkedAt timestamp, 12:44:26 UTC, as the first. The second open cost 0 units. That is the behaviour you want from any tool that reads the YouTube API on your behalf: a colleague opening the same link, a reload, a crawler following it, none of them should spend quota again. The report prints the time it was retrieved under the table, so you always know how old the numbers are.
Thirty days is YouTube's limit for stored API data, and it is why nothing on the page is older than that. From the comment sample the tool keeps counts, plus up to three unanswered buying questions as text, with no names. If you want to see how 18 units compares with the other free tools, the quota calculator does the arithmetic for a day's use.
What is free without an account, and what does a free account add?
Without an account: 3 fresh scans a day, the channel line, all five scores and their verdicts, the three fixes, every section with its numbers and charts, the sponsor summary and tiles, and the first three sponsor rows with their dates, evidence and example videos. On my report that means Trigger.dev, Oracle and Teleport are open and the panel under them says 6 more sponsors, the codes and the CSV are behind a free sign-in. The data on the page is public API data presented as-is, and it stays open because YouTube's policies say not to gate API data behind a sign-up for its own sake, and because the free single-channel report is how people find us.
A free account adds the rest of the sponsor table with codes and evidence, every fix, 10 fresh scans a day, and for the first 7 days the full detail behind every score, plus saving the report to a workspace where it can be watched for new sponsors and compared with another channel. No YouTube channel connection is needed; Google or a one-time link to a work email is enough. After the 7 days a free account keeps every sponsor row, the five scores, the three fixes and the detail behind the first score, with up to 10 saved reports and 3 fresh scans a day; the detail behind the other four scores, the business contact the creator published, the CSV, compare and the watch list are part of the Creator plan at $12 a month and every paid plan.
I want to be clear about which side of the line each thing sits on, because the blur under the third sponsor row is the first thing people ask me about. The facts are free. The advice, the export and the saving are what the account is for.
What broke
Five real things, from my own channel and from the tool's logs.
One in five scans was a repeat click. The scan runs on the server while the browser waits for the next page, which takes 4 to 8 seconds, and a page that does nothing visible gets clicked again. The form's own code notes that one in five scans was a repeat within 30 seconds before the fix. So the moment the form is submitted the button now locks, a progress line appears, and a second submit is ignored; the server also merges duplicate scans of the same channel into one. Coming back with the browser's back button restores the page from cache with the button still locked, which was its own small bug, and the form now resets on that event. If you ever clicked Analyze twice in October, that was you, and it was my fault for showing nothing.
0 of 246 uploaded captions on my own channel. Not a bug in the tool, a gap in my channel. I have relied on auto-generated captions on every video the report read, back to March 2020, and the API's caption flag only counts a track the creator uploaded. Fifteen points of discoverability sit there, and the fix is one upload per video, starting with the five outliers.
4 sponsored videos without the paid-promotion label on my own channel. Also not a bug. Nine of my videos name a sponsor in the description, and five carry the flag. The other four are a minute each in Studio, and the report has shown them as fix number three since 30 October. I am writing this so that the next time I open Studio I have no excuse.
The N8n row. My sponsor table lists N8n with 1 video, the same n8n tutorial that Hostinger sponsored. n8n is the subject of that video, not its sponsor; the description links to the n8n documentation because the video teaches n8n. On a sponsored video every outside link is a candidate, and the analyzer filters out documentation, government and well-known reference domains, then marks the rest of the uncertain ones "possible". n8n's domain was not on the reference list, so it shows as a possible row, greyed, for a person to confirm. The page's own FAQ has the question "Why is a website listed as a sponsor when it is just a tool the creator used?" because it happens, and the honest answer is: open the example video before you count it. It is also the clearest example of why the two "possible" rows are kept apart from the seven sure ones rather than being added to the sponsor count.
The second fetch cost 0 units, and I had to check that it did. This is the one that went right, but only because I tested it. The same report fetched twice returned cached: true with the same 12:44:26 UTC timestamp. Earlier in the autumn a cached report from an older version of the tool was served as fresh for an hour after a release, and reports now carry a version so that an old one is re-scanned on the next open. Caches that are not checked are caches you do not have.
What this means for you
Read the report top to bottom, in the order it is laid out. The channel line sets the scale, the dials give the verdict, and the sections give the numbers. A score you do not understand is explained directly underneath it.
Read the sample size next to every ratio. My audience care 100 is 15 of 15 threads; a 34 on 226 threads is a bigger channel that answered more comments than I did. The number next to the number is half the meaning.
The chart beats the score. My engagement 41 is a ratio; the median views by length chart (36.4K for videos over 30 minutes against 11.3K under 8) is the actual finding, and it became my first fix.
Discoverability gaps are checkboxes. Tags, chapters, uploaded captions, titles under 70 characters, a set language. One afternoon in Studio moves this score more than any new video. My 0 of 246 captions is the proof that I have not spent that afternoon.
In the sponsor table, trust the chips and the dates before the names. Three chips and a "returned" badge is a deal that worked; a greyed "possible" row is a link to confirm, not a brand to count.
Expect the second open to be free and the numbers to be dated. If a tool reading the YouTube API for you does not say when it read the data, or spends quota every time you reload, it is not being careful with a shared resource.
Run it on your own channel before you run it on anyone else's. The fixes it gives you are the ones a brand's junior analyst will see in the first ten minutes of vetting you, and it is better to know before they do.
Quick answers
Is the channel analyzer an official YouTube tool?
No. It reads public data through the official YouTube Data API and the scores, fixes, niche and sponsor grouping are ReplyDial's own analysis, labelled as such on the page. YouTube Studio's private analytics are richer and only available for your own channel; this works on any public channel from the outside.
Can I analyze a channel that is not mine?
Yes. Any public channel by handle or link, no sign-in, 3 a day. Agencies use it on creators they are vetting; creators use it on channels one size bigger in their niche to see who sponsors them.
Why does my newest video not appear in the report?
A report is reused for a day so that repeat opens cost no quota. After that a refresh link appears under the headline and the channel is read again.
Why is the engagement score low on a channel with millions of views?
Because it is built from ratios (likes and comments per 100 views, median views per subscriber), and ratios do not scale with size. In October I compared eight channels from 105,000 to 5.45 million subscribers and every one scored between 38 and 49 on engagement. Read the median views and the length chart instead.
What does "possible" mean in the sponsor table?
A link on a sponsored video that may be a reference rather than the sponsor. On my own report, n8n is possible because it is the subject of the Hostinger-sponsored tutorial. Open the example video to confirm before you count it.
This week, with no tool at all: open your own channel's Videos tab, sort by popular, write down the length of your ten most-viewed videos, then sort by newest and write down the length of your ten newest. If the two lists do not look alike, you have found your first fix, the same way the report found mine.
ReplyDial's free channel analyzer does that read for the newest 300 videos of any public channel in under ten seconds, with the five scores, the fixes and the sponsor table with evidence; ReplyDial itself is the inbox for answering your own channel's comments, which is the one score on the page you can move today.
See your own unanswered comments
ReplyDial lists every comment on your channel still waiting for a reply, drafts answers in your voice, and posts only what you approve. Free for 7 days on Creator limits, no card.
Consistency, engagement, discoverability, commercial readiness and audience care, 0 to 100 each from public data. The rules, my scores, 8 channels compared.
How the analyzer's discoverability score is built: six packaging checks with fixed weights. My 70 and three others, 54 to 70, recomputed by hand on 9 Nov 2026.
Studio's Response status: Unresponded filter lists the comments you never answered. What it counts, what it misses, and my channel's numbers on 9 November 2026.