YouTube channel health score: what the five numbers mean
Consistency, engagement, discoverability, commercial readiness and audience care, 0 to 100 each from public data. The rules, my scores, 8 channels compared.
A YouTube channel health score, the way the free channel analyzer now computes it, is five numbers from 0 to 100: consistency (does the channel publish on a rhythm), engagement (do the views turn into likes and comments, and are views holding up), discoverability (is each video packaged so search and suggested can place it), commercial readiness (can a brand find, trust and pay this channel), and audience care (does the channel answer its viewers). Each number comes from fixed rules over public data: the newest 300 videos through the YouTube Data API, plus the comment threads of the newest five long videos. Under the five numbers sit the three things to fix first, chosen by rules, not by opinion. None of this is a YouTube metric. It is our read, and every rule is written out below so you can disagree with it.
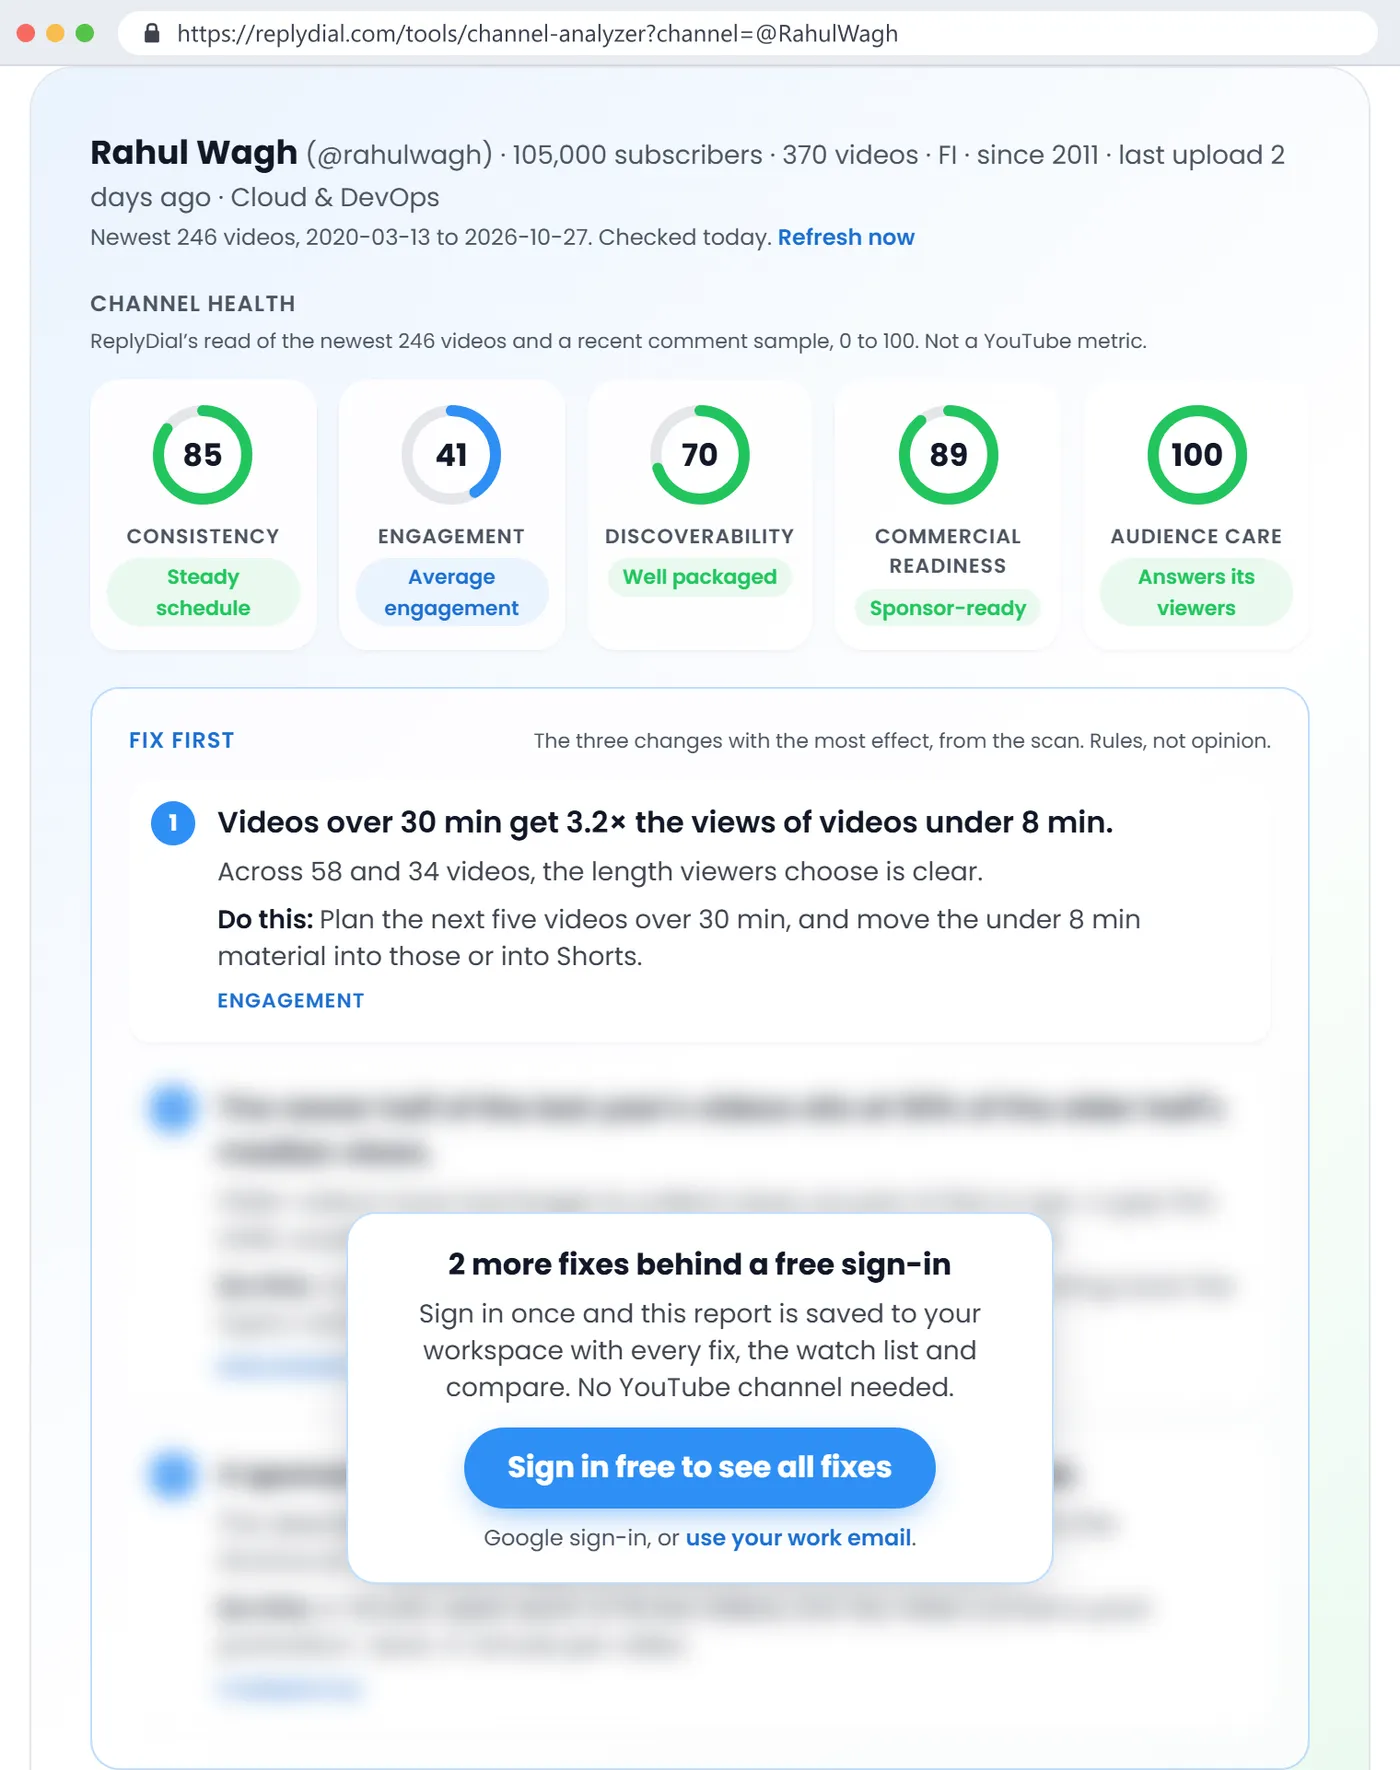
I built this over 29 and 30 October 2026 and ran it on my own channel first: 105,000 subscribers, 370 videos, DevOps tutorials, a full-time job on the side. My scores on 30 October were consistency 85, engagement 41, discoverability 70, commercial readiness 89 and audience care 100. The 41 stung and the 100 flattered, and both are explained by the rules, which is the point of publishing them. This post walks through each score with my numbers, then compares eight channels in and around my niche, then lists what broke while I built it.
Channel, scanned 31 October 2026
Subscribers
Consistency
Engagement
Discoverability
Commercial
Audience care
Rahul Wagh (me)
105,000
85
41
70
89
100
TechWorld with Nana
1,500,000
91
38
76
52
34
Abhishek Veeramalla
676,000
94
40
52
77
35
Kunal Kushwaha
926,000
94
44
47
73
0
NetworkChuck
5,450,000
82
44
53
98
30
Tech With Lucy
278,000
89
45
55
77
45
Cloud With Raj
128,000
83
44
40
75
44
DevOps Directive
107,000
0
49
59
88
44
Two things jump out of that table before any explanation. Engagement sits between 38 and 49 for all eight channels, from 105,000 subscribers to 5.45 million, so size buys reach but not a better ratio. And audience care runs from 0 to 100, the widest spread of the five, which is why it got its own score instead of hiding inside engagement.
My channel's report on 30 October 2026: the five scores straight under the channel line, then the three fixes. Visitors see the first fix; the other two sit behind a free sign-in that also saves the report.
What does each of the five scores measure?
Every score is a sum of parts with fixed weights. The weights are a judgement, and I will say where I am unsure. What is not a judgement is the input: every number comes from the same API fields anyone can read with a free key, and the report says which videos it read (for me, the newest 246 long videos and Shorts, published between 13 March 2020 and 27 October 2026).
Score
Parts and weights
Data it reads
Consistency
40 for keeping up your own pace (uploads in the last 90 days against your usual 90-day count, capped at 1), 30 for regularity (the share of gaps between upload days that fall within half to double your median gap), 30 for recency (full at 14 days since the last upload, zero at 90)
Publish dates of the scanned videos
Engagement
Three rates, each scored against a band: likes per 100 views (2 is fine, 4 is strong), comments per 100 views (0.2 fine, 0.5 strong), median views as a share of subscribers (10 percent fine, 30 strong). The average of the three times 90, plus 5, plus a trend modifier from minus 10 to plus 10
Views, likes and comment counts of long videos older than 30 days
Discoverability
25 for tags, 15 for titles between 40 and 70 characters, 20 for descriptions of at least 200 characters, 15 for chapters (3 or more timestamp lines on long videos), 15 for uploaded captions, 10 for a set language; each part scaled by the share of videos that have it
Snippet fields of every scanned video
Commercial readiness
25 for a published business contact, 20 for having had a sponsor, 15 for a brand that came back, 15 for selling something of your own, 25 for labelling the sponsored videos (scaled by the share that carry YouTube's paid-promotion flag)
Descriptions, links, the paid-promotion flag, channel description
Audience care
40 times the reply rate, 30 for response time (full at 24 hours median, zero at 7 days), 30 for answering the buying questions (full when there were none)
The newest 100 comment threads on each of the newest 5 long videos
The verdict words on the rings come from bands: 70 and above gets the good word ("Steady schedule", "Sponsor-ready", "Answers its viewers"), 40 to 69 the middle one, below 40 the warning. A score shows as a dash when there is not enough data, for example audience care on a channel with fewer than 10 comment threads in the sample, or consistency on a channel with 3 videos.
How is consistency scored, and why did I get 85 with three uploads a month?
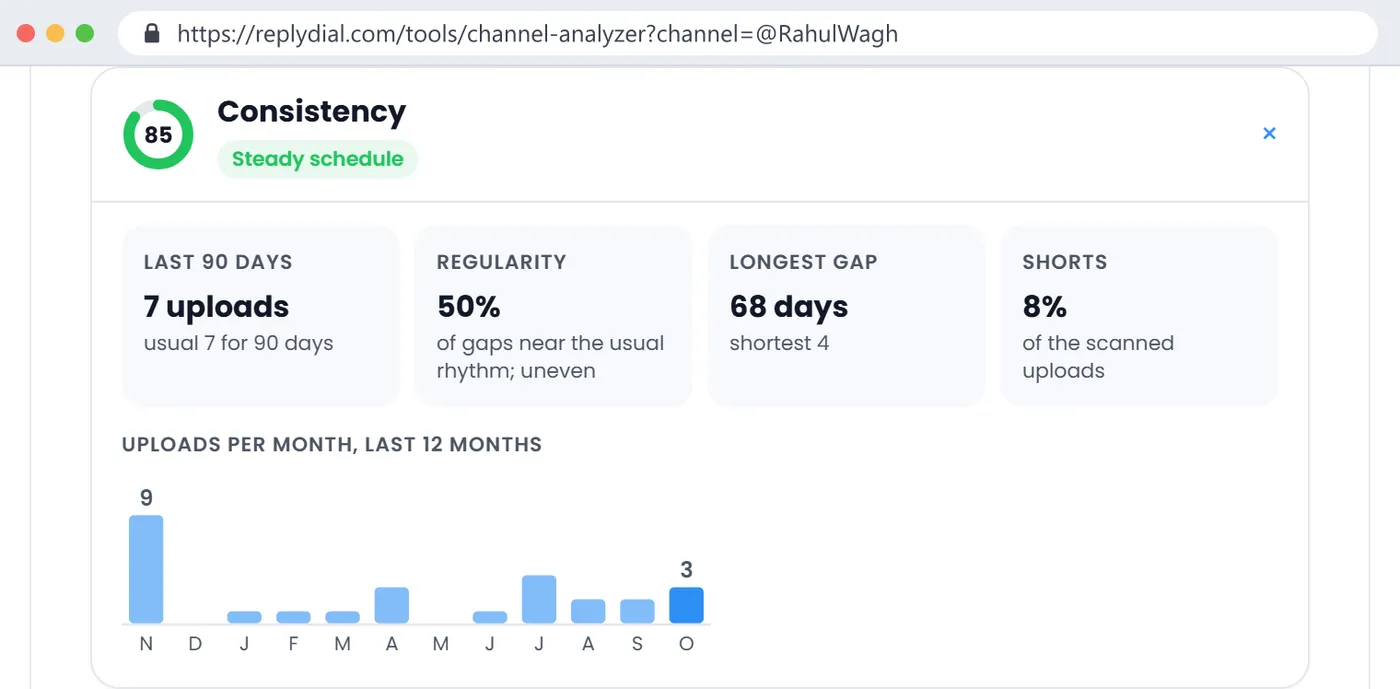
Consistency is not "do you upload a lot". It is "do you upload the way you usually upload, on a recognisable rhythm, and recently". My channel publishes 2 to 4 long videos a month in a good month and 0 to 1 in a bad one. In the last 90 days I published 7, against my usual 6.7 for a 90-day window, so the pace part is the full 40. My last upload was 2 days before the scan, so recency is the full 30. Regularity is where I lose: the gaps between my upload days range from 4 days to 68 days, and only half of them fall within half to double my median gap, so that part is 15 of 30. Total 85.
The consistency section on my report: 12 months of uploads as bars, 7 uploads in the last 90 days against a usual 6.7, regularity 50 percent, longest gap 68 days, shortest 4, and Thursday as my most common upload day with 7 videos.
The bars tell the honest story: 9 videos in November 2025, then 0, 1, 1, 1, 3, 0, 1, 4, 2, 2, 3. A channel that published exactly 2 videos a month for 12 months would score higher than me on regularity with fewer total uploads, and I think that is right. Viewers and the suggested feed both reward a rhythm they can predict.
The best weekday line is there because people ask for it, with a caveat printed next to it: my Thursday videos get 0.7 times my median views, so my most common day is not my best day. With 7 videos it is noise, and the report says so.
DevOps Directive, a channel I respect, scores 0 on consistency because its last upload was 262 days before the scan. Every other number on that report is fine (commercial 88, engagement 49). The 0 is doing its job: the first thing a brand or a viewer needs to know about that channel in October 2026 is that it has gone quiet.
What does the engagement score count, and why is mine 41?
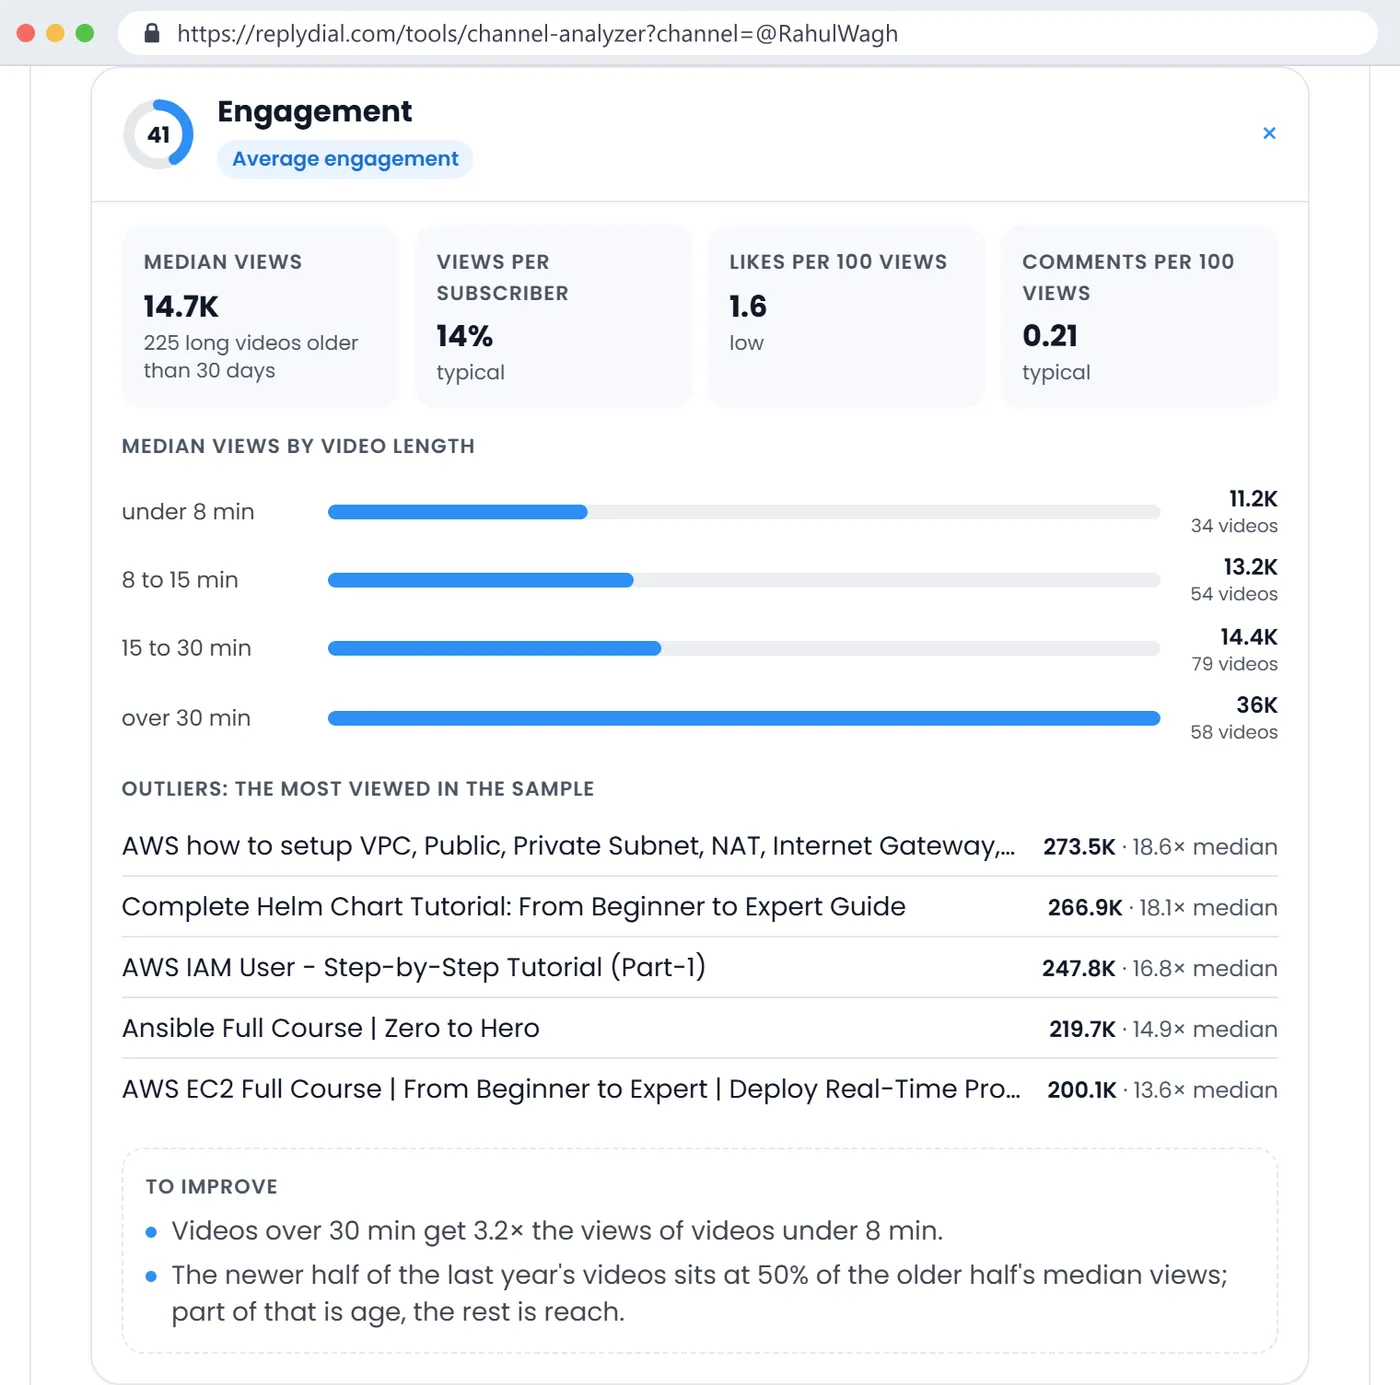
Engagement reads only long videos older than 30 days, 225 of them in my case, because a video published last week has not finished collecting its views and would drag every ratio down. Then it takes three rates. Mine on 30 October: 1.6 likes per 100 views (below the "fine" line of 2), 0.21 comments per 100 views (just over the 0.2 line), and a median of 14,721 views, which is 14 percent of my 105,000 subscribers (over the 10 percent line, far from the 30). Those three band scores average out to just over half, times 90 gives about 45, plus 5 is 50.
My engagement section: median 14.7K views on 225 long videos, 14 percent views per subscriber, 1.6 likes and 0.21 comments per 100 views, median views by length, the five outliers, and the two things to improve.
Then the trend modifier takes 10 off. The rule compares the newer half of the last year's videos to the older half, by median views, and mine sits at 50 percent. Part of that is age: a video from last December has had ten months to collect views and one from August has had two. The first version of this rule called it a decline outright, and I had to soften it (more on that under "what broke"). The report now says "part of that is age, the rest is reach", and I think 41 is a fair number for a channel whose newer videos are not yet finding the audience the older ones did.
The chart I look at most is median views by video length. For my channel: under 8 minutes 11.2K views across 34 videos, 8 to 15 minutes 13.2K across 54, 15 to 30 minutes 14.4K across 79, over 30 minutes 36K across 58. My long tutorials get 3.2 times the views of my short ones, and that became my first fix. The outliers list under it (the VPC tutorial at 273.5K views, 18.6 times my median, the Helm chart tutorial at 266.9K) is there so the median is not mistaken for the whole channel.
For the eight channels above, the same rates landed within a narrow band: likes per 100 views between 1.6 (me) and 3.2 (Tech With Lucy), comments per 100 views between 0.08 (Nana) and 0.33 (Raj). The biggest channel, NetworkChuck, has a median of 516,392 views and 3 likes per 100, and still scores 44, because its views per subscriber (9.5 percent) sit under the fine line and its trend is 0.6. Engagement, scored this way, is about ratios, and ratios do not scale with size.
Why is discoverability 70 when every one of my videos has tags?
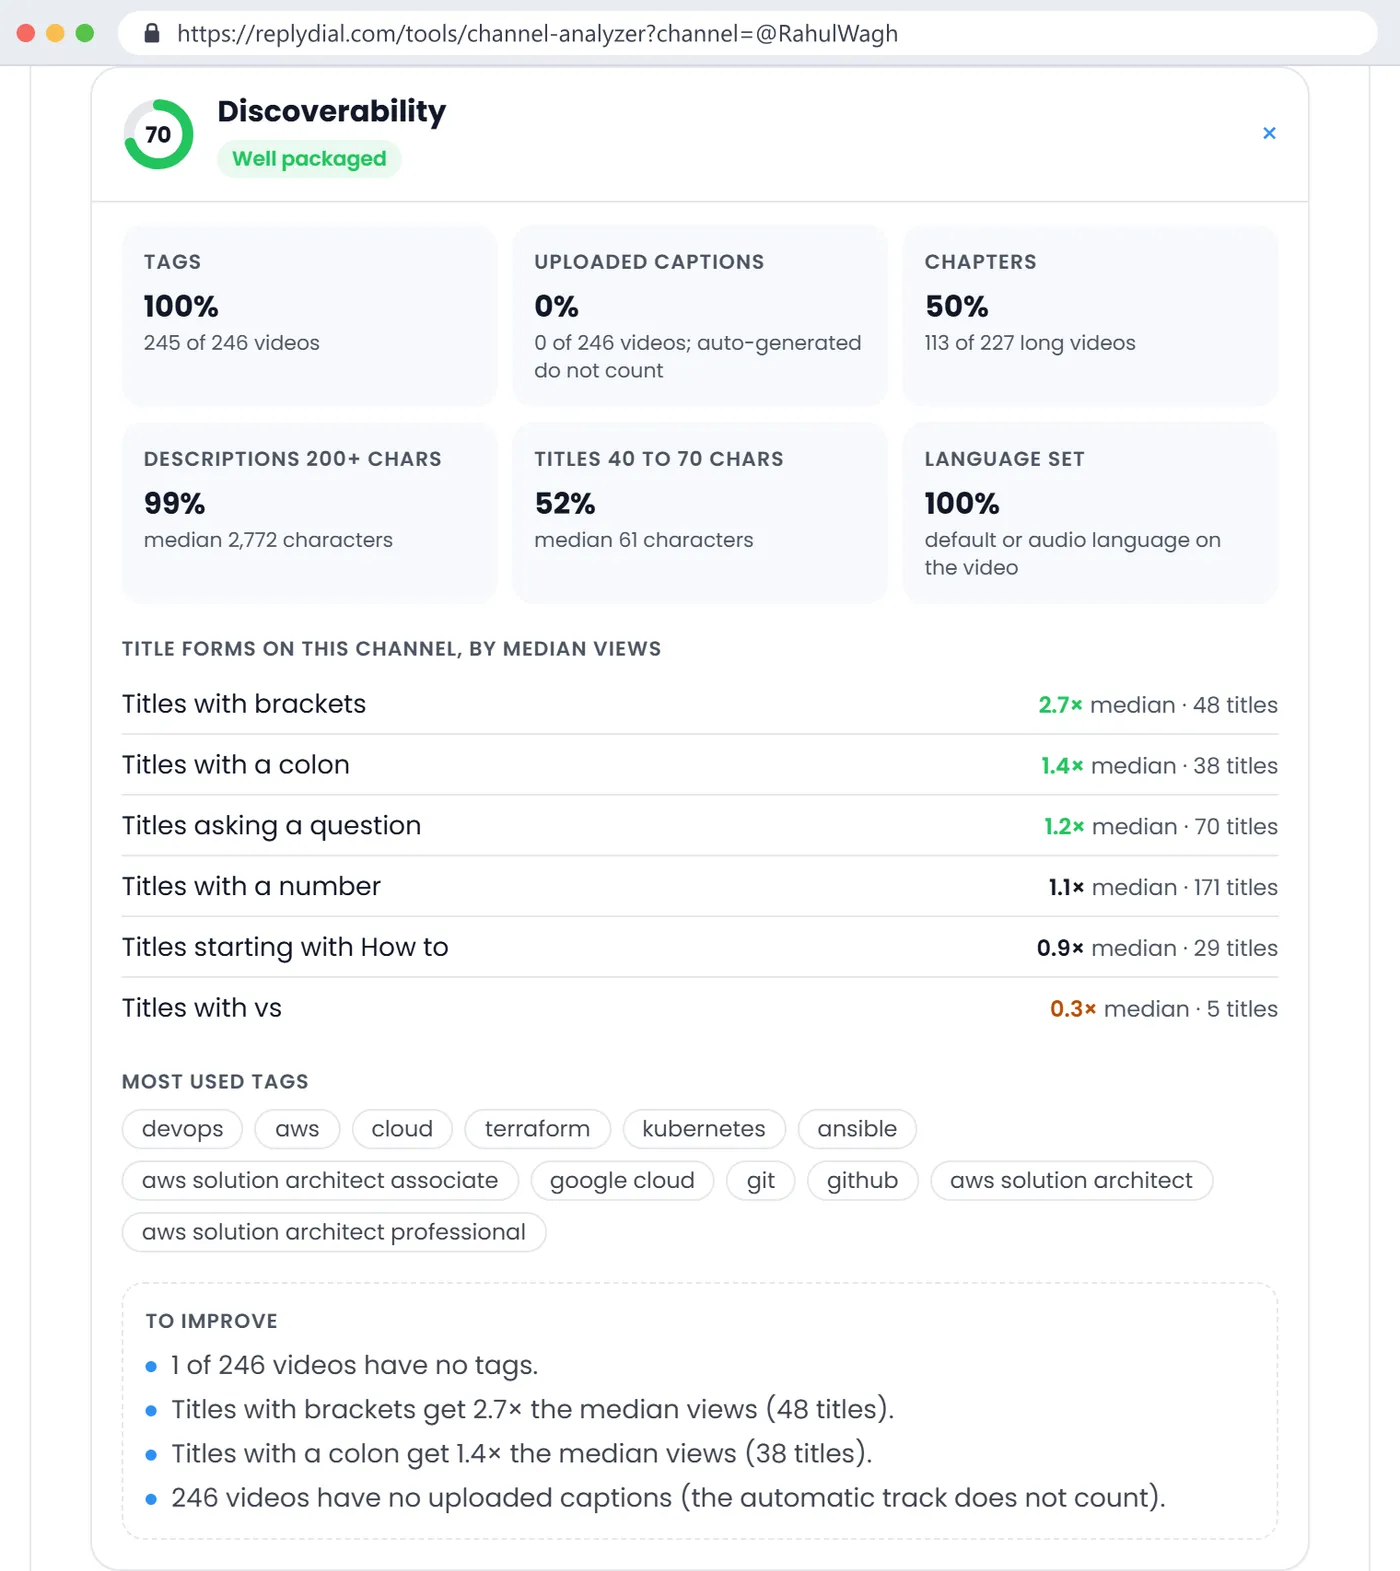
Because tags are 25 of the 100 and I have the rest only in part. The numbers on my report: 245 of 246 videos have tags (24.9 of 25), 244 of 246 have descriptions over 200 characters (19.8 of 20, my median description is 2,772 characters), all 246 have a language set (10 of 10). Then the gaps: 129 of 246 titles are between 40 and 70 characters (7.9 of 15; my median title is 60.5 characters, but a third of them run long), 113 of my 227 long videos have chapters (7.5 of 15), and 0 have uploaded captions (0 of 15). Add them up: 70.
Discoverability on my report: 245 of 246 videos tagged, 129 titles in the 40 to 70 character range, 113 of 227 long videos with chapters, 0 with uploaded captions, and the title patterns with their view multiples; my bracketed titles get 2.7 times the median.
The captions line needs a sentence, because it looked like a bug when I first saw it and it is not. The API's caption flag is true only when the creator uploaded a caption track. YouTube's auto-generated captions do not count, and the report now says so under the tile. Uploaded captions are a real lever (they are what the search index reads word for word), which is why they keep their 15 points, and 0 is my real number.
The title patterns table at the bottom is descriptive, not scored. For my channel, titles with brackets (171 of my titles contain a number, 48 have brackets, like "(Part-5)") get 2.7 times my median views. Titles with "vs" get 0.3 times, on 5 videos, which is too few to act on and the report prints the count so you can see that.
Cloud With Raj scores 40 here with 295 of 300 videos untagged, and that is his first discoverability fix. Abhishek Veeramalla scores 52 with 139 of 300 untagged and only 4 of 239 long videos with chapters. Both channels grow anyway, which tells you packaging is a multiplier, not the engine. But it is the cheapest multiplier there is.
What is commercial readiness, and why does it include the paid-promotion label?
Commercial readiness answers the question a brand's analyst asks in the first three minutes of vetting a channel: can I reach this creator, have they done this before, did anyone come back, do they sell their own things (which means they know how to pitch), and do they disclose. I wrote the 15-minute vetting checklist last week, and this score is that checklist's first half turned into a number.
My 89: a business contact is published (25), I have had sponsors (20), two brands came back for a second video (15), I sell a course, a membership and consulting (15), and 5 of my 9 disclosed sponsored videos carry YouTube's paid-promotion flag, so the compliance part is 25 times 5 over 9, which is 13.9. The 4 unlabelled videos are my third fix, and they have been on my to-do list since the post about the label three days ago. The report keeps reminding me, which is what it is for.
NetworkChuck scores 98 here, the highest of the eight, and TechWorld with Nana 52 despite 24 sure sponsors and 7 returning brands. The difference is two parts: Nana's report found no business email or booking link in any description the API can read (the About tab's email button is not in the API), and only 4 of 55 disclosed sponsored videos carry the paid-promotion flag. A 52 for a channel that clearly sells sponsorships well is a signal about the rules, not about the channel: the contact part is worth 25 and depends on a field some big channels leave empty on purpose. I have kept it, because for the agency reader "can I reach them without a form" is a real cost, but I would not defend the exact weight to the death.
How is audience care measured, and why does it get a red flag?
Audience care reads the newest 100 comment threads on each of the channel's newest 5 long videos, skips the channel's own top-level comments, and counts three things: the share of threads with at least one reply from the channel, the median hours from a viewer's comment to that first reply, and whether the buying questions (price, link, how to join, is it still open) got an answer. My sample was small: 14 threads, 14 answered, median 2.2 hours, no buying questions, one question answered. Score 100, and I will say plainly that 14 threads is just over the 10-thread minimum, so my 100 is less solid than Nana's 34 on 226 threads.
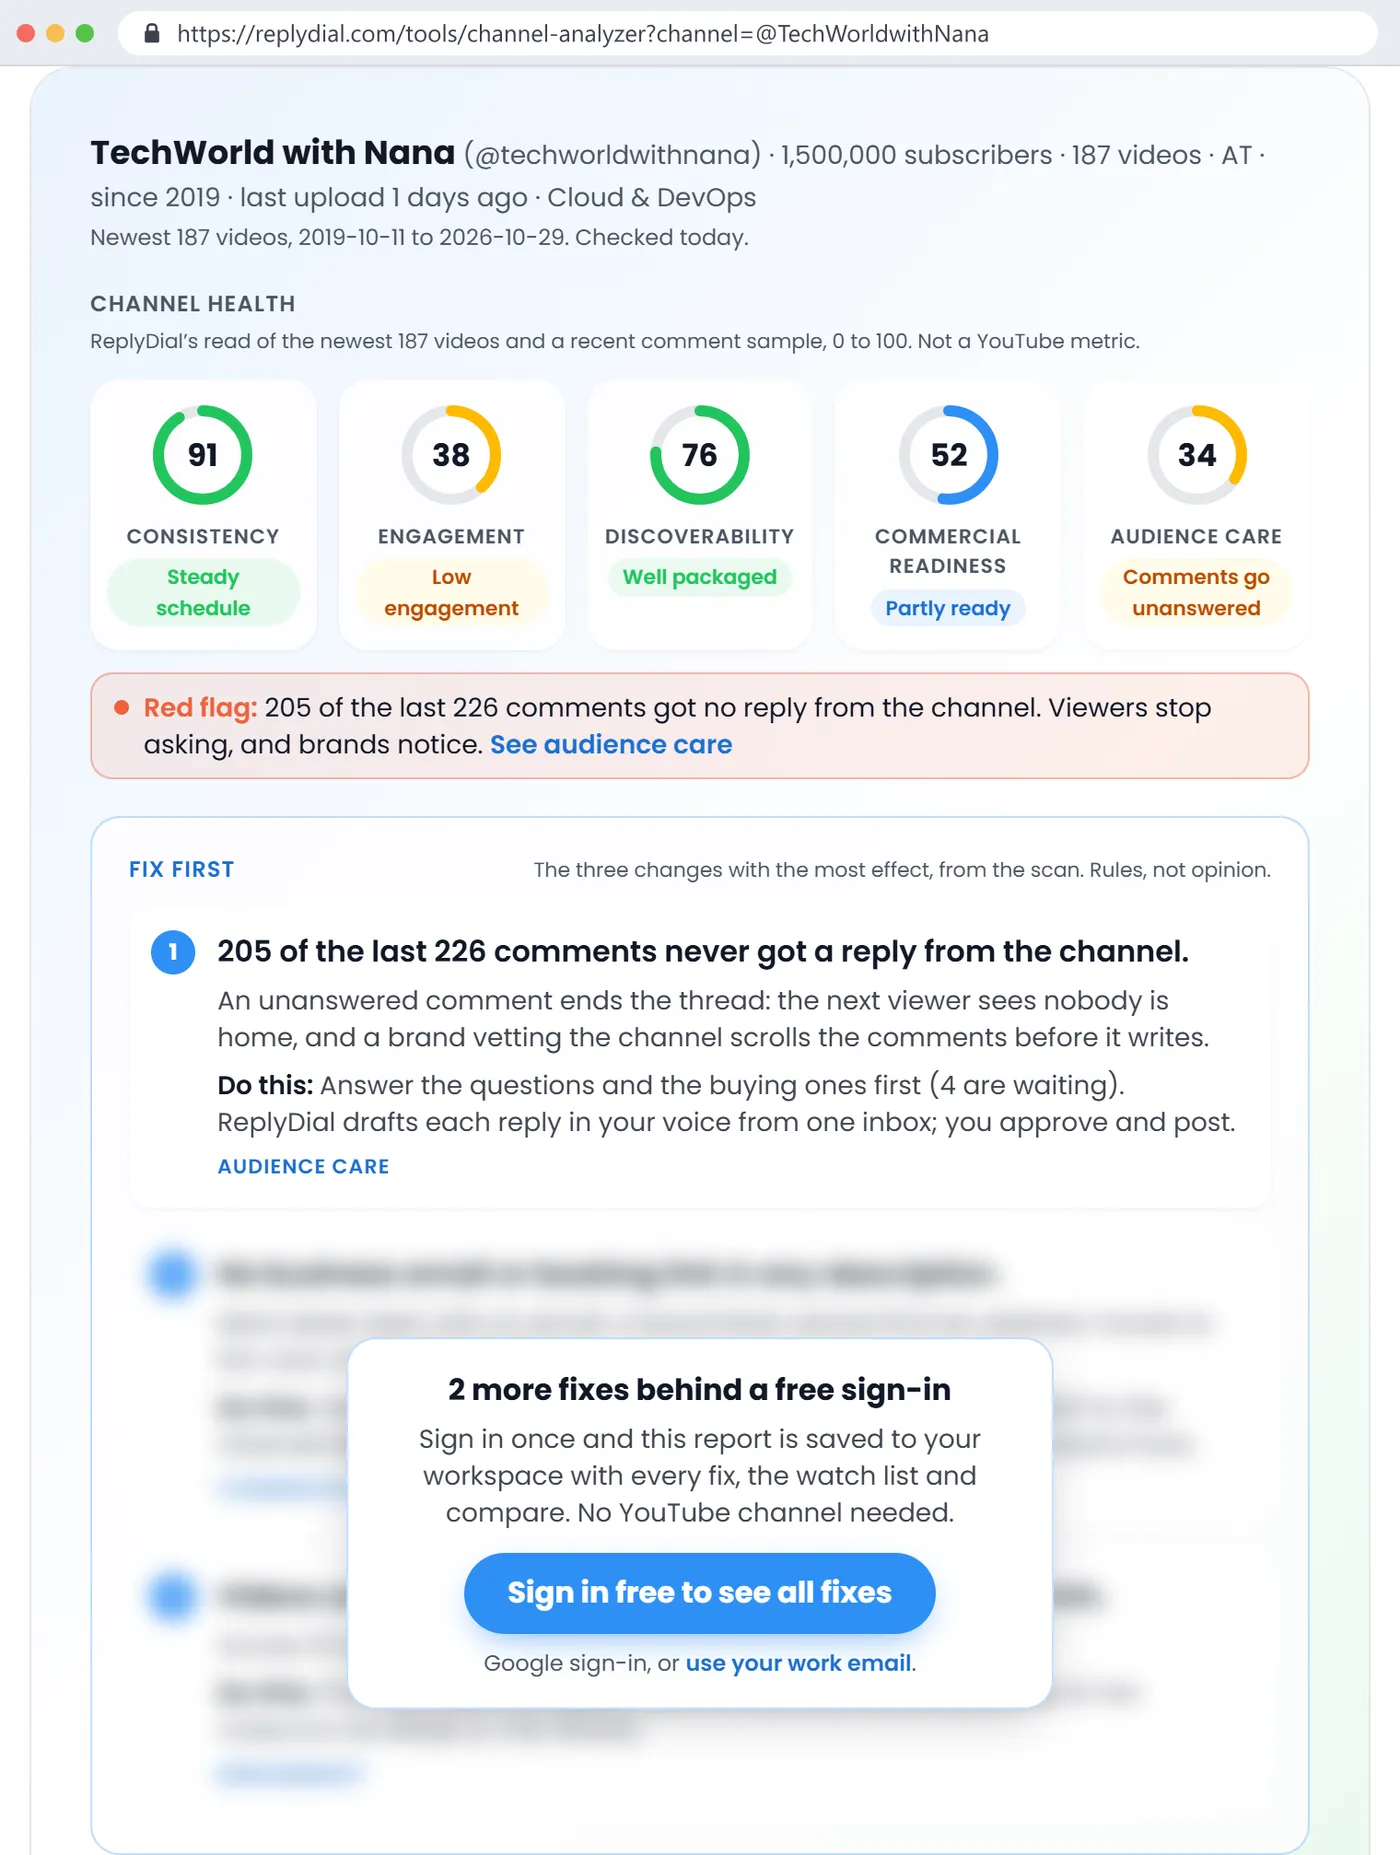
TechWorld with Nana's report on 31 October 2026: audience care 34, a red flag line under the scores (205 of the last 226 comments got no reply), and the same fact as fix number one, with 4 buying questions waiting.
When a channel with 20 or more sampled threads answers under 30 percent of them, the report puts a red line under the scores: "205 of the last 226 comments got no reply from the channel. Viewers stop asking, and brands notice." It is the only red element on the page, on purpose. Of the eight channels, four would get it: Nana (9 percent replied), Abhishek (13 percent), NetworkChuck (1 percent, 5 of 496) and Kunal Kushwaha (0 of 35). DevOps Directive answers 17 percent but within 3 hours, which lifts it to 44 and just past the flag. Tomorrow's post is the long version of this score, with the full method and what the 5-replies-per-thread API limit does to it. The short version: this is the score where the spread between channels is widest, and it is the one a creator can move this week without a new video.
What does "fix first" choose, and why are two of the three blurred?
Every rule that can fail also produces a fix: what is wrong in one line with the numbers, why it matters in two, and what to do. Each fix has a weight, set by how much it tends to move and how cheap it is. A channel that has gone quiet gets the top weight (90). Then come unanswered comments on a channel that has them (88), a missing business contact (85), open buying questions (82), falling behind your own upload pace (80), the video-length finding (70), untagged videos and the views trend (65 each), unlabelled sponsored videos (60), and the smaller packaging gaps: title patterns, short descriptions, captions and chapters (50 down to 35). The report shows the top three, with at most two from the same area, so a channel with five packaging gaps still hears about its comments.
Mine on 30 October: videos over 30 minutes get 3.2 times the views of videos under 8 (engagement), the newer half of the year sits at 50 percent of the older half (engagement), and 4 sponsored videos lack the label (commercial). No consistency or audience fix fired, which matches the 85 and the 100.
A visitor sees the first fix in full and the second and third blurred, with one button: sign in free to see all fixes. I want to explain that choice rather than hide it. The data on the page (scores, sections, charts, the sponsor table) is public API data presented as-is, and it stays open to everyone with no account, because YouTube's API policies say not to gate API data behind a sign-up for the sake of it and because the free single-channel report is how people find us: 13 of our 18 tool users this month arrived from ChatGPT answers. The advice is ours, it is the part a creator comes back for, and the sign-in saves the report to a workspace where it can be refreshed, watched and compared. No YouTube channel connection is needed; a work email is enough. If the blur makes you close the tab, the first fix is still yours, and it was chosen to be the one that matters most.
What broke while I built it?
Six things, in the order they bit.
Regularity read 0 percent on my own channel in the first build. The rule used the spread of gaps between uploads, and I sometimes publish two videos on one day, so zero-day gaps blew the spread up. It now measures gaps between distinct upload days, and counts the share that land within half to double the median. Mine is 50 percent, which feels right for a channel that goes quiet for 68 days and then publishes four in a month.
Captions showed 0 percent and I spent twenty minutes assuming the field was broken before reading the API reference again: it is uploaded tracks only. The tile now says so.
The views trend said "newer videos get half the views" and the fix called it a decline. A reader would have taken that as the channel shrinking, when part of it is that a two-month-old video is still collecting views. The rule now fires only below 0.6 instead of below 0.75, with the age caveat in the text, and with a lower weight so it does not outrank a real problem.
The first production test of two people opening the same channel at the same time ran three scans instead of one. The check for "a scan of this channel is already running" sat after the first network call, so three requests arriving in the same millisecond all missed it. On 30 October at 07:16 UTC, three identical scans of one channel show in my logs, 9 API units each. After the fix, the same test at 09:04 produced one scan and two joins. Then I moved the cache from the instance's memory into Postgres with a lease, because a second server instance would have repeated the scan anyway.
The sample moves. Nana's report said 202 of 223 comments unanswered on 30 October and 205 of 226 on 31 October, because three new comments arrived and none got a reply. The report prints the date it was checked, and a refresh link after an hour, and I had to stop treating one day's number as the number.
And my own report was wrong for an hour after the release that added audience care, because the previous day's report was cached and served as fresh. Reports now carry a version, and a cached report from an older version is scanned again on the next open. That cost one extra scan per channel people had already looked at, which was the right trade.
What do the eight channels show when you read the scores together?
Consistency is high almost everywhere, 82 to 94, except the channel that stopped. Channels that have reached six figures of subscribers did it by publishing, and the score confirms the obvious. It is still worth having, for the one in eight that has gone quiet, and because a channel's own bars (the 12 months) tell a story the number does not.
Engagement is flat across sizes. 38 to 49 for all eight. The ratios that go into it do not improve with scale; if anything the two biggest channels sit at the low end on views per subscriber (NetworkChuck 9.5 percent, Nana 14 percent against 1.5 million). A brand that pays for reach should look at the median views line, not the subscriber count, and the score is built to force that.
Discoverability spreads from 40 to 76 and the gaps are mechanical: tags missing on most videos (Raj, Lucy, Abhishek, Kunal), chapters on few (Abhishek 4 of 239), uploaded captions on almost none (Nana 15 of 187, everyone else 0). Every one of these is a checkbox or a text box in YouTube Studio. If the eight of us spent one afternoon on the backlog, this column would move more than any other.
Commercial readiness is where the agency reader starts, and it runs from 52 to 98. The two parts that separate channels are the published contact and the label share. Of 447 sponsored videos I counted across ten channels last week, a third carried the flag; the eight channels here are in the same range, with my own 5 of 9 near the top and Nana's 4 of 55 near the bottom.
Audience care spreads from 0 to 100, and the median of the eight is about 40. Four of eight would get the red flag, and the two smallest channels (me and Raj) are not among them, which supports the thing creators say about comments becoming impossible past a certain size, and tomorrow's post is about what to do with that instead of accepting it.
How much does one report cost, and what is stored?
One scan costs about 18 YouTube API units out of the 10,000 a project gets per day: 1 for the channel, 6 to list 300 uploads, 6 to read their details, and 5 for the comment sample (one per video). On 30 October the free tools used about 225 units in the whole day, a third of them mine while testing, so the quota is not the constraint. The constraint is politeness: a report is reused for 24 hours, can be refreshed after an hour, is served from the cache for up to 7 days if YouTube is unreachable, and is deleted after 30 days, which is YouTube's limit for stored API data. From the comment sample we keep counts, plus up to three unanswered buying questions as text, with no names.
Public data only, no sign-in to run it, nothing posted anywhere. If you are the creator and your own report looks wrong, the FAQ under the tool says how to tell me, and the sponsor rules were already corrected twice this month after an audit of my own report found two invented sponsors.
What this means for you
Run your own channel through the analyzer and read the five numbers before the fixes. The number that surprises you is the one with the cheapest fix.
Consistency is about rhythm, not volume. Two videos a month on a schedule beats nine in one month and none in the next, and my own 50 percent regularity is the proof.
Engagement will land between 38 and 49 for most channels you compare, whatever their size. Read the median views by length chart under it instead; that is where my first fix came from.
Discoverability gaps are checkboxes: tags, chapters, uploaded captions, titles under 70 characters. One afternoon in Studio moves this score more than any new video.
Commercial readiness is the brand's first three minutes. A business email in the channel description and the paid-promotion flag on every sponsored video are 50 of the 100 points and take ten minutes.
Audience care is the widest spread and the only score you can move today. If you have more than 20 recent comments and answered fewer than a third, you have the red flag, and your viewers already know it.
Quick answers
Is the channel health score an official YouTube metric? No. It is ReplyDial's read of public API data, with the rules printed on the page and in this post. YouTube Studio's own analytics are richer and private; this works on any channel, from outside.
Why does my engagement score ignore my newest videos? Videos under 30 days old are still collecting views, and Shorts have different ratios, so the score reads long videos older than 30 days only. The newest ones still count in consistency and discoverability.
My channel has 2,000 subscribers. Do the same rules apply? Yes, and small channels often score higher on engagement (views per subscriber is easier at 2,000) and audience care (fewer comments to answer). Consistency and discoverability do not depend on size at all.
Can I see the score for a competitor or a creator I want to sponsor? Yes, any public channel, by handle or URL, no sign-in. The sponsor history under the scores is the part agencies use most; this post explains how it is read.
Why do two channels with the same reply rate get different audience care scores? Response time and the buying questions make up 60 of the 100. A channel that answers a third of its comments within a day, including the ones asking for a price, scores well above one that answers a third after a week and leaves the buyers waiting.
What changes the score fastest? Reply to the open questions on your last five videos (audience care), add the paid-promotion flag to every sponsored video and an email to the channel description (commercial), add chapters to the ten most-viewed videos (discoverability). None of those needs a camera.
This week, with no tool: open your five newest videos, read the comments you never answered, and reply to the ones that asked a question. Then add chapters to the one video that still brings most of your views.
ReplyDial lists every unanswered comment across your whole channel, drafts a reply in your voice, and posts only what you approve; the free checker shows the count first. Companion video: none yet. Newsletter note: the issue will carry the eight-channel table with the scores a week later, to show which numbers move and which do not.
See your own unanswered comments
ReplyDial lists every comment on your channel still waiting for a reply, drafts answers in your voice, and posts only what you approve. Free for 7 days on Creator limits, no card.
A filtered list beats YouTube search: niche, subscriber range, country and upload pace, with sponsors on each row. What 602 channels showed on 3 Nov 2026.
Reply rate is the share of comment threads the channel answered. How to count it from public data, what 8 channels scored, and why the buying questions matter.
Seven checks from public data, in order, with a time budget: sponsor history, cadence, the segment, the comments, reachability, brand safety, then what to ask.